
Othot Partner Success Team

Last year we issued our Enrollment Trends Pulse Report providing observations on 2020 enrollment trends. The national average saw a 13% decline in first-year full-time enrollment, however, we found colleges and universities that used sophisticated advanced analytics to build their fall admissions classes only had an average year-over-year decrease of 4.74%.
This year, we’ll be tracking enrollment trends again, starting a bit earlier than last year and reporting monthly on the Othot blog, culminating in the 2021 Enrollment Trends Pulse Report.
As we enter the 2021 yield season and monitor enrollment progress toward the May 1 decision day, we are tracking applicant, admit, and deposit trends, much like our higher education partner institutions. We call our customers partners because we invest in and support our partners and their goals.
We’re sharing the trends that we’re seeing among our partners, of course, segmented based on institution type (private vs. public) and in aggregate. Our partner institutions represent a cross-section of the higher education landscape, covering private and public, large and small, rural, and urban, and specialized programs.
The following insights are based on data from our partner institutions captured as of March 1, 2021, and primarily focus on new first-time student results.
Key Takeaways
Some of the key takeaways from the data trends are:
- Application rates increased year to date, demonstrating positive success in engaging students during the prospect and inquiry phases, even if partner institutions managed engagement through more virtual means.
- With admission rate increases year over year in aggregate and at a higher rate than applications, the trend demonstrates institutions may be working more diligently to process decisions and to provide quicker responses to students.
- While overall deposit rates are ahead of last year, it is still very early in yield season, and the total deposit numbers are still relatively low. Minor shifts in deposit quantities day after day can shift the year-to-date trends. Monitoring this rate as we get into April and especially May will provide greater insight into overall trends.
- Keep in mind the pandemic began impacting enrollment around March last year, so comparing this year’s results to last year could be different.
Keep reading for the 2021 trends for private and public institutions, including applicants, FASFA completion, admits, and deposits.
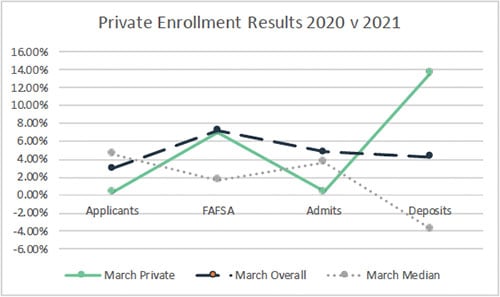
Private Institution Trends
Private institutions are weathering the 2021 enrollment cycle, seeing growth in deposits, up 13.55% from 2020, and in FAFSA completion, up 7.05% from 2020. Applicants and admits are nearly flat when compared to 2020, indicating that institutions are continuing to positively engage students, virtually or on-campus, during an enrollment cycle fraught with uncertainty by the pandemic.
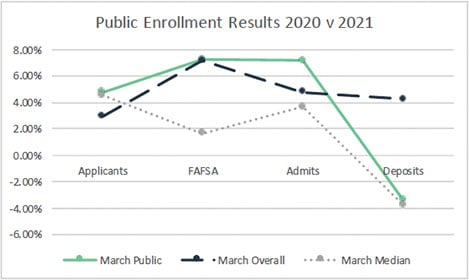
Public Institution Trends
Public partner institutions are also experiencing positive trends in the 2021 enrollment cycle except for deposits. Larger applicant pools led to an increase in FAFSA completion and admits in 2021 over 2020. While deposits are down over last year, the March data is merely the start of yield season, and it is too early to call if the trend is an indicator of what the next months will bring.
2021 Enrollment Cycle Observations
Applicants
Institutions didn’t let the pandemic get in the way of filling their funnels and generating additional applicants from interested prospective students, which increased overall for our partner institutions.
Why?
One common thread is the pandemic. Many unknowns remain with COVID-19, such as vaccine distribution, campus policies, virus resurgence, and they change daily. That uncertainty prompted students to apply to more schools, leading to an increase in applications.
We are also seeing increases in applications among our partner institutions that have more rigorous admissions criteria, whereas schools with less rigorous admissions criteria, applications declined.
FAFSA Completion
Over the past few months, we’ve heard a lot of concerns about the decline in FAFSA completion and how it could potentially impact enrollment. While some of our partner institutions are seeing FAFSA submission rates behind last year’s numbers, overall, FAFSA submissions are up year to date.
When we look back to January 1, FAFSA submissions increased 2.64% from 2020 to 2021 across all our partner institutions. Not only did this rate hold, but it more than doubled by March 1. Overall, FAFSA submission rates year over year at March 1 have increased by 7.19%.
Admits
While institutions control the admission decision, it is valuable to monitor how quickly schools are working to process decisions. Applications are up over last year, and both public and private institutions have higher than average rates for admits this year compared to last year.
One reason may be the number of institutions that went test-optional for admissions. In a recent WSJ article, “College Admissions Season is Crazier Than Ever. That Could Change Who Gets In,” colleges with test-optional admissions are seeing an ‘unprecedented flood of applications.’
That’s true among our partner institutions too. Partners that previously required higher test scores and adopted test-optional admissions had an increase in applications, leading to a rise in admits.
Deposits
The results for deposit trends on March 1 take a different shape than applications and admits.
Across the aggregated data for our partner institutions, deposits on March 1 increased by 4.24% over 2020. However, deposits declined by 3.38% for public institutions, while they increased 13.55% for private institutions.
As we get into April and especially toward the tail end of the month, the deposit trends will be the best indicator for enrollment. Looking at the early March deposit rates is illustrating a trajectory for many institutions and we are looking forward to sharing the early April deposit rates to see if the trend holds.
What Do These Trends Mean for the 2021 Enrollment Cycle?
It is important to remember that while quantity trends can help monitor enrollment progress, quantity alone can't answer if you are on track for your enrollment goals. Understanding the quality of the students who applied and were admitted to your institution is just as critical.
Quality, in this case, does not refer to academic profile, but rather it is defined as a measure of the likelihood that each student matches the profile of students who previously enrolled at your institution. The quality measure, with the quantity, indicates if you will achieve your enrollment goals.
Increases in quantity can provide a false sense of security if the applicant’s profiles vary differently from students who historically enroll and succeed.
We will continue to monitor trends and provide additional updates for April 1, May 1, and thereafter so that you can benchmark against other institutions. Progression through the funnel, with key awareness of how students are behaving and engaging with your institution, will illustrate where you’ll end up next Fall term.

Othot Partner Success Team