
Othot Partner Success Team
Last month, we provided the first snapshot of enrollment trends among our partner institutions for Fall 2021.
We're continuing to track trends and recently reviewed applicant, admit, FAFSA submission, and deposit data from our partner institutions. The following insights are based on data from our partner institutions captured as of April 1, 2021, and primarily focus on new first-time student results.
Key Takeaways
A few of the key takeaways from the April 1 data trends are:
- Application and admission rates continue to increase overall across both private and public institutions.
- Deposit rates, already ahead of last year for private institutions, continued to grow over the past month. However, deposit rates, already behind last year for public institutions, continued to fall over the past month.
- Test-optional admissions is impacting not only the trend results but also how our partner institutions approach application reviews.
Keep reading for the 2021 enrollment trends for private and public institutions, including applicants, FASFA completion, admits, and deposits.
Private Institution Trends
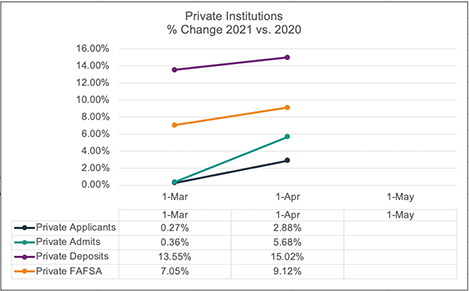 Private institutions saw applicant and admission rates slightly above last year at the beginning of March; however, the year-to-date comparison is trending positive for the 2021 enrollment cycle.
The chart above illustrates the upward trend in applicants, admits, deposits, and even prospective students filing FAFSA.
The April rates show applications up nearly 3% compared to last year.
While March 1 deposit rates were significantly up over last year, the rates have continued to increase, now 15% greater than last year. While many more deposits generally filter in throughout April and thereafter, the results to date are positive.
Public Institution Trends
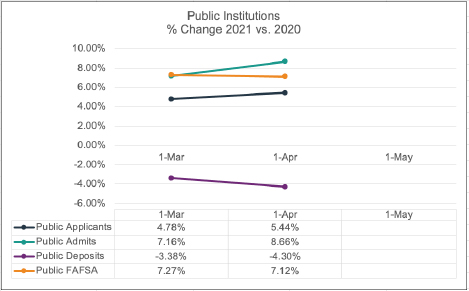
Similar to the March 1 results, public partner institutions are experiencing positive trends in the 2021 enrollment cycle, except for deposits. Applicants and subsequent admits continued to increase over last year’s results.
However, it is concerning to see an already low deposit rate continue to decline. We now see a 4% decline in deposits year to date.
2021 Enrollment Cycle Observations
What is the data telling us, and what are we hearing from our partners?
The impact of test optional is real and causing multiple effects. Across all our partner institutions, the applicant rate increased by almost 4.5% from last year.
The college-age student population is not growing at a significant rate, and our data, as well as other reports, indicate that students are likely applying to more institutions.
Test scores are no longer a requirement or barrier for students, and many are applying to institutions they may not have previously.
Similarly, the admit rates year to date across all our partner institutions is about 7.6% ahead of last year. With an increase in applicants, one could expect at least the same increase in admits, assuming the average profile of students remains consistent across the entire applicant population.
However, with the admit rate even higher than the applicant rate, and with all the uncertainty from the 2020 admission cycle, these data suggest institutions are hedging against lower yield, thus admitting more students.
Aside from what the data shows, our partner institutions shared insights about the impacts of test-optional admissions:
- At least one institution reported 60% of applications submitted did not have test scores, which was much higher than expected or projected at the beginning of the recruitment cycle.
- The increase in test-optional application submissions significantly impacted the resources needed to review student applications. Some institutions are thinking about improving the admission review process for the 2022 cycle if they remain test optional.
- Some partner institutions are already ahead of their typical admission rate causing them to avoid or limit the decision to review a waitlist population.
While the impact of test optional is driving increases in applicants and admits across the board, it is always important to monitor significant behavioral trends like depositing.
While private institutions are up significantly and public institutions are down significantly, the overall college-age student population isn’t increasing, so all institutions should be wary of the false sense of security caused by an increase in early funnel activity.
Fewer deposits and higher melt are trends to monitor closely.
What Do These Trends Mean for the 2021 Enrollment Cycle?
Early funnel trends (applicant and admit rates) show a promising opportunity, but institutions should be cautiously optimistic.
May 1 always provides a good indication for enrollment based on deposits, whether you are an institution that is strongly aligned to the May 1 results or use that as a benchmark for additional activity early in the summer months.
In 2020, deposit deadlines shifted from May 1 to June 1 and even later for many institutions. The deposit deadline change is something to monitor and consider, both by institutions and by students, if the change persists into this enrollment cycle.
We will continue to monitor trends and provide additional updates for May 1 and into the summer and fall so that you can benchmark against other institutions.
The focus of the analysis will shift to the deposit and later stage activity.
We are planning to share some additional insight about the impact of test-optional admissions on our partner institutions, reviewing the academic profile changes of the incoming class compared to last year.
Stay tuned for more trends and insights.

Othot Partner Success Team