
Othot Partner Success Team
Throughout yield season, we’ve monitored enrollment trends at March 1 and April 1. We're continuing to track trends for the applicant, admit, FAFSA submission, and deposit data from our partner institutions.
The following insights are based on institutional data captured as of May 1, 2021 and focus primarily on new first-time student results.
In addition to reviewing the trends from National Decision Day, we’ve included insights into how test-optional admissions played out this year.
Key Takeaways
A few of the key takeaways from the May 1 data:
- Application and admission rates continue to increase for both private and public institutions.
- Deposit rates took a significant jump from April 1, with rates higher than last year. Private institutions are 23% and public institutions are 9% ahead year-to-date.
- Test-optional admissions impacted the enrollment cycle this year, with over 60% of students applying test optional, over 55% of admitted students applied test optional, and over 50% of deposited students applied test optional.
Keep reading for the 2021 enrollment trends for private and public institutions, including applicants, FASFA completion, admits, deposits, and test-optional results.
Private Institution Trends
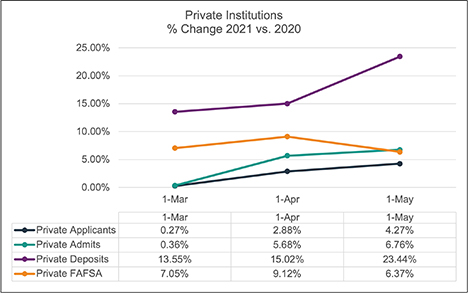 This chart shows the percent change from 2021 to 2020 for private institutions.
When reviewing the March and April results, the private institutions had applicant and admission rates slightly above 2020. The year-to-date comparison for May continue with the positive trend and even increased slightly
What is even more incredible to see is that deposit rates, already ahead year-to-date in prior months, continued to increase even on May 1. The results for private institutions deposit as of May 1 are over 23% higher than last year.
Let’s keep in mind that some of our partner institutions extended the May 1, 2020 deposit deadline.
This year, many of those same institutions reverted to a May 1 deadline. It will be interesting to monitor how the June 1 results compare for deposits because of this behavior change.
Public Institution Trends
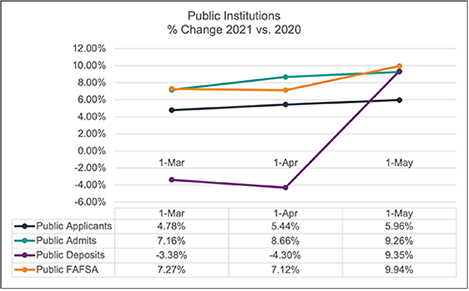
This chart shows the percent change from 2021 to 2020 for public institutions. |
If you recall from the March and April analyses, applicants and admit rates were higher than the 2020 enrollment cycle. However, deposit rates were significantly behind. That changed during the month of April.
The deposit rates on May 1, 2021 are now ahead of last year by over 9%.
The increased volume in applicants and admits finally yielded similar trends for deposits. Again, like private institutions, public institutions shifted deposit deadlines in 2020 by a month to June 1. Some reinstated the May 1 deadlines this year.
Test-Optional Results
The impact of the pandemic drove many institutions to implement test-optional admissions this year. It is difficult to monitor year-over-year trends among our partner institutions because test-optional admissions may not have been an option during the last enrollment cycle.
But we still wanted to understand what the results showed us on May 1, 2021 for the overall population of students that applied, were admitted, and deposited as test optional.
The following summary table and charts break out the test-optional percentages across our partner institutions by institution type.
Test-Optional Applicants, Admits, Deposits by Institution Type
| May 1 Results | Overall | Private | Public |
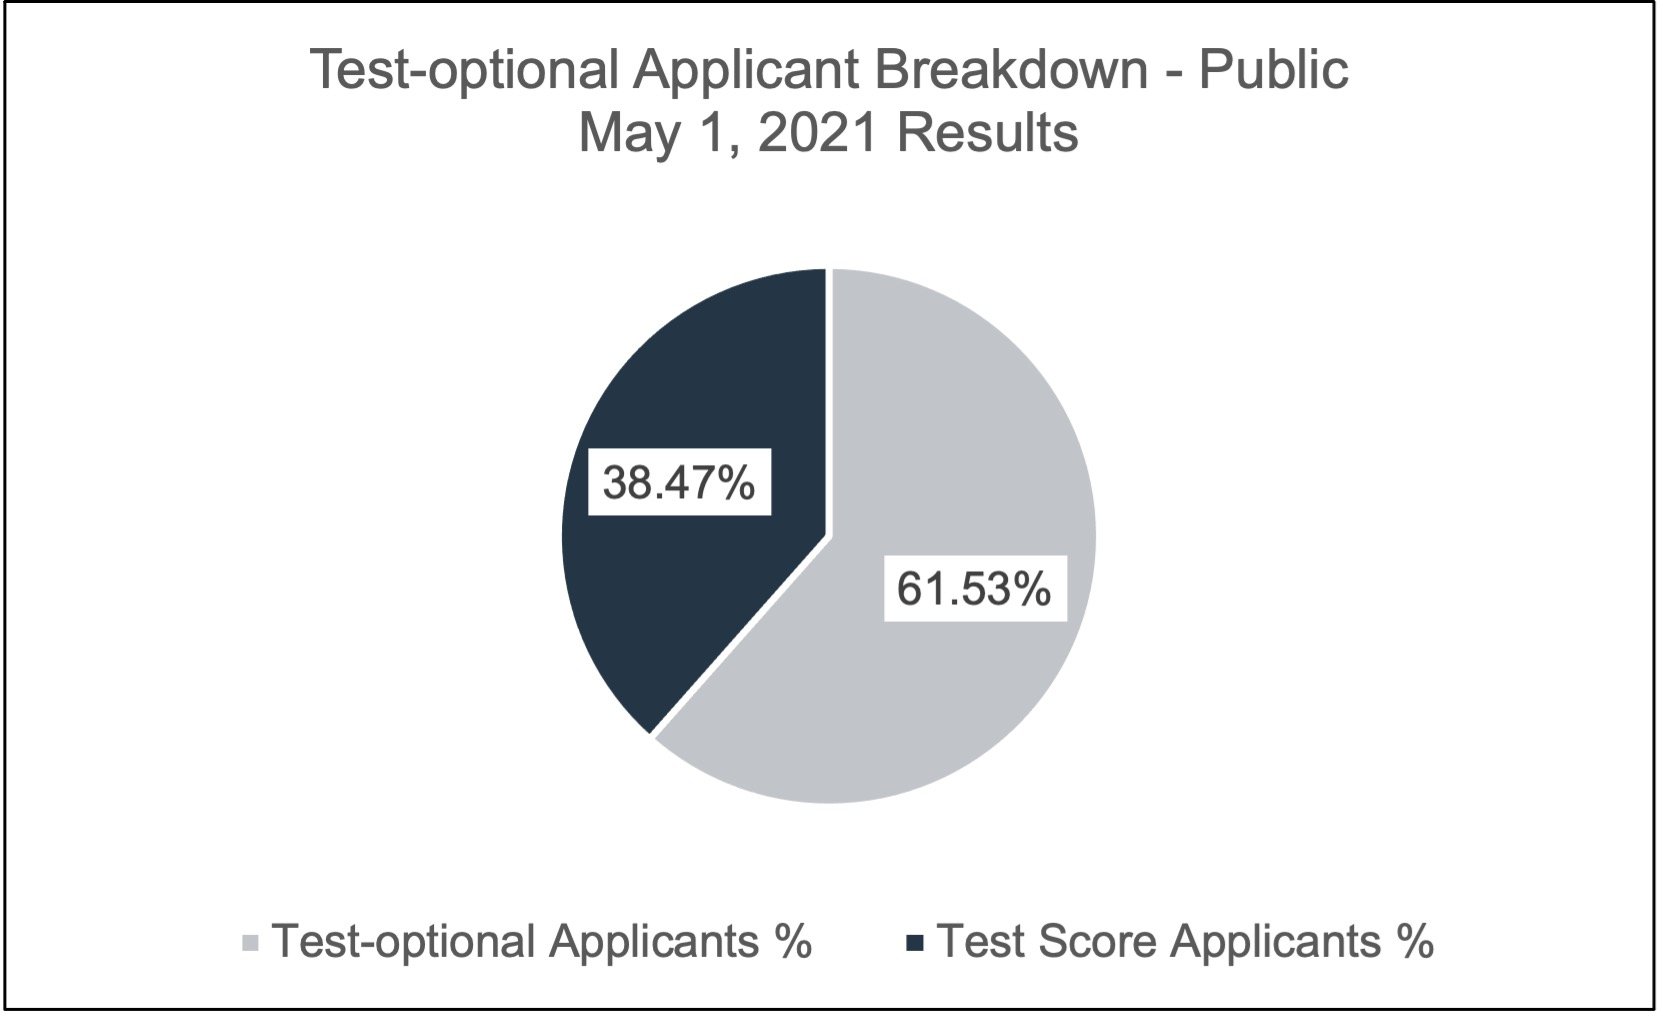
| Test-Optional Applicants | 61.77% | 63.02% | 61.53% |
| Test Score Applicants | 38.23% | 36.98% | 38.47% |
| Test-Optional Admits | 56.79% | 55.56% | 56.90% |
| Test Score Admits | 43.27% | 44.44% | 43.10% |
| Test-Optional Deposits | 54.65% | 50.94% | 55.06% |
| Test Score Deposits | 45.35% | 49.06% | 44.94% |
|
This chart shows test-optional applicants at public institutions |
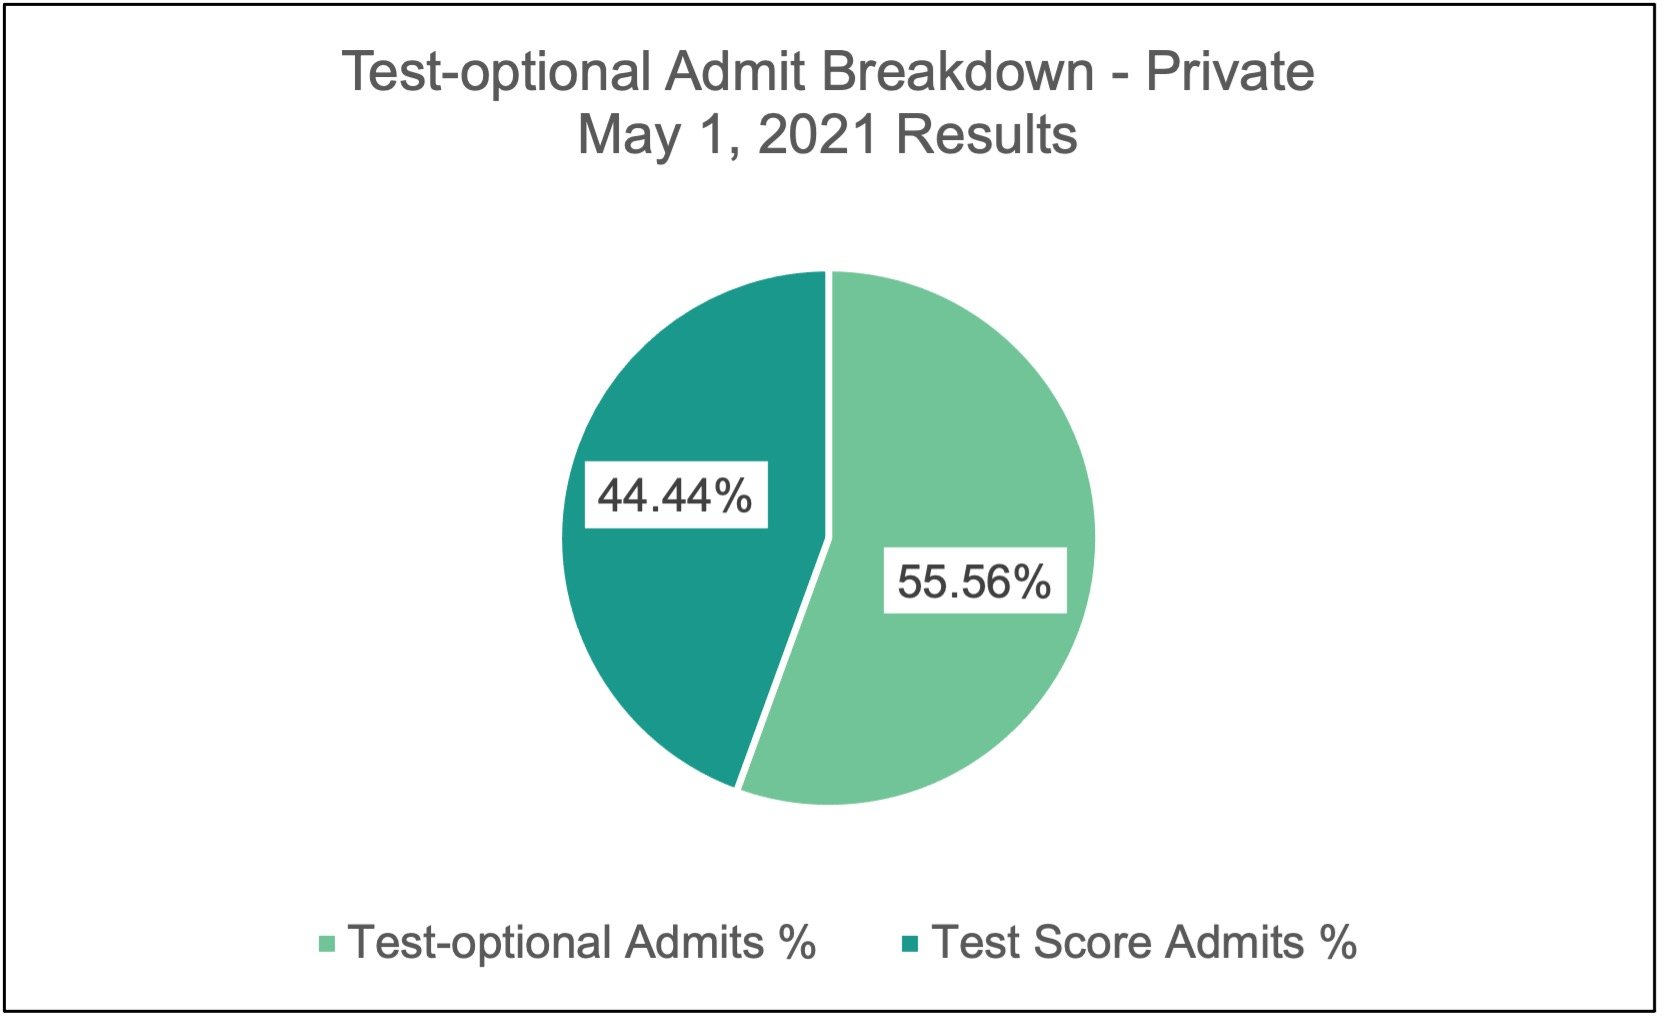
This chart shows test-optional admits at private institutions. |
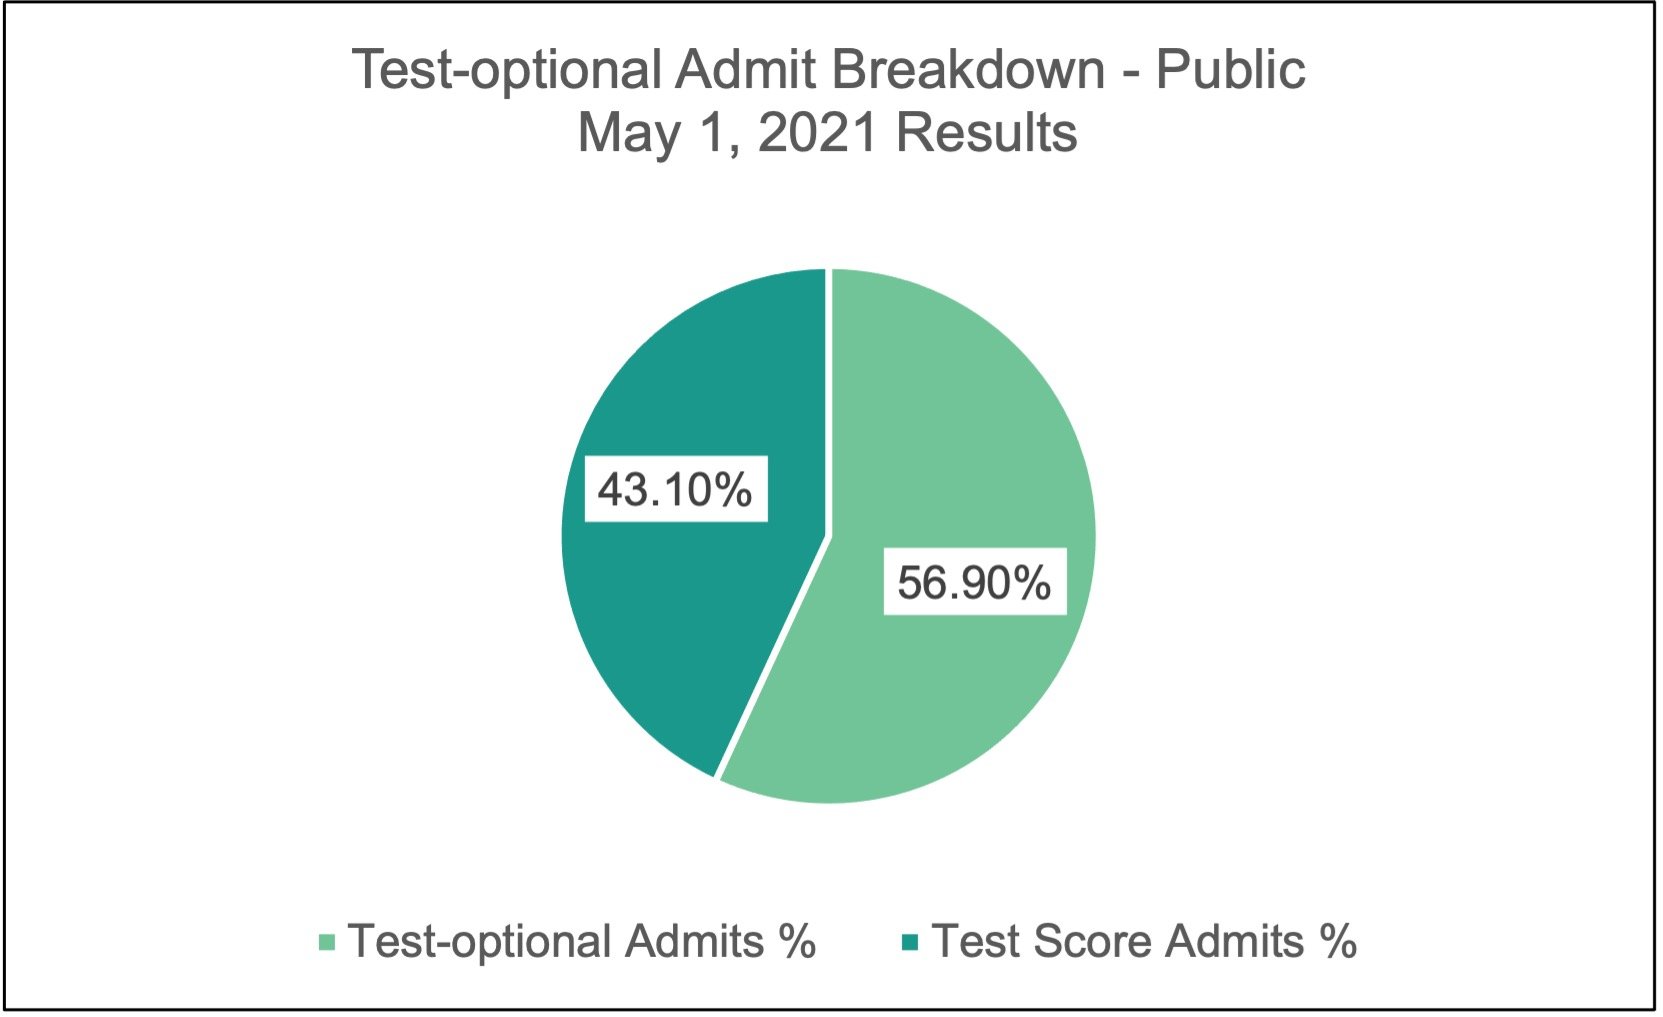
This chart shows test-optional admits at public institutions. |
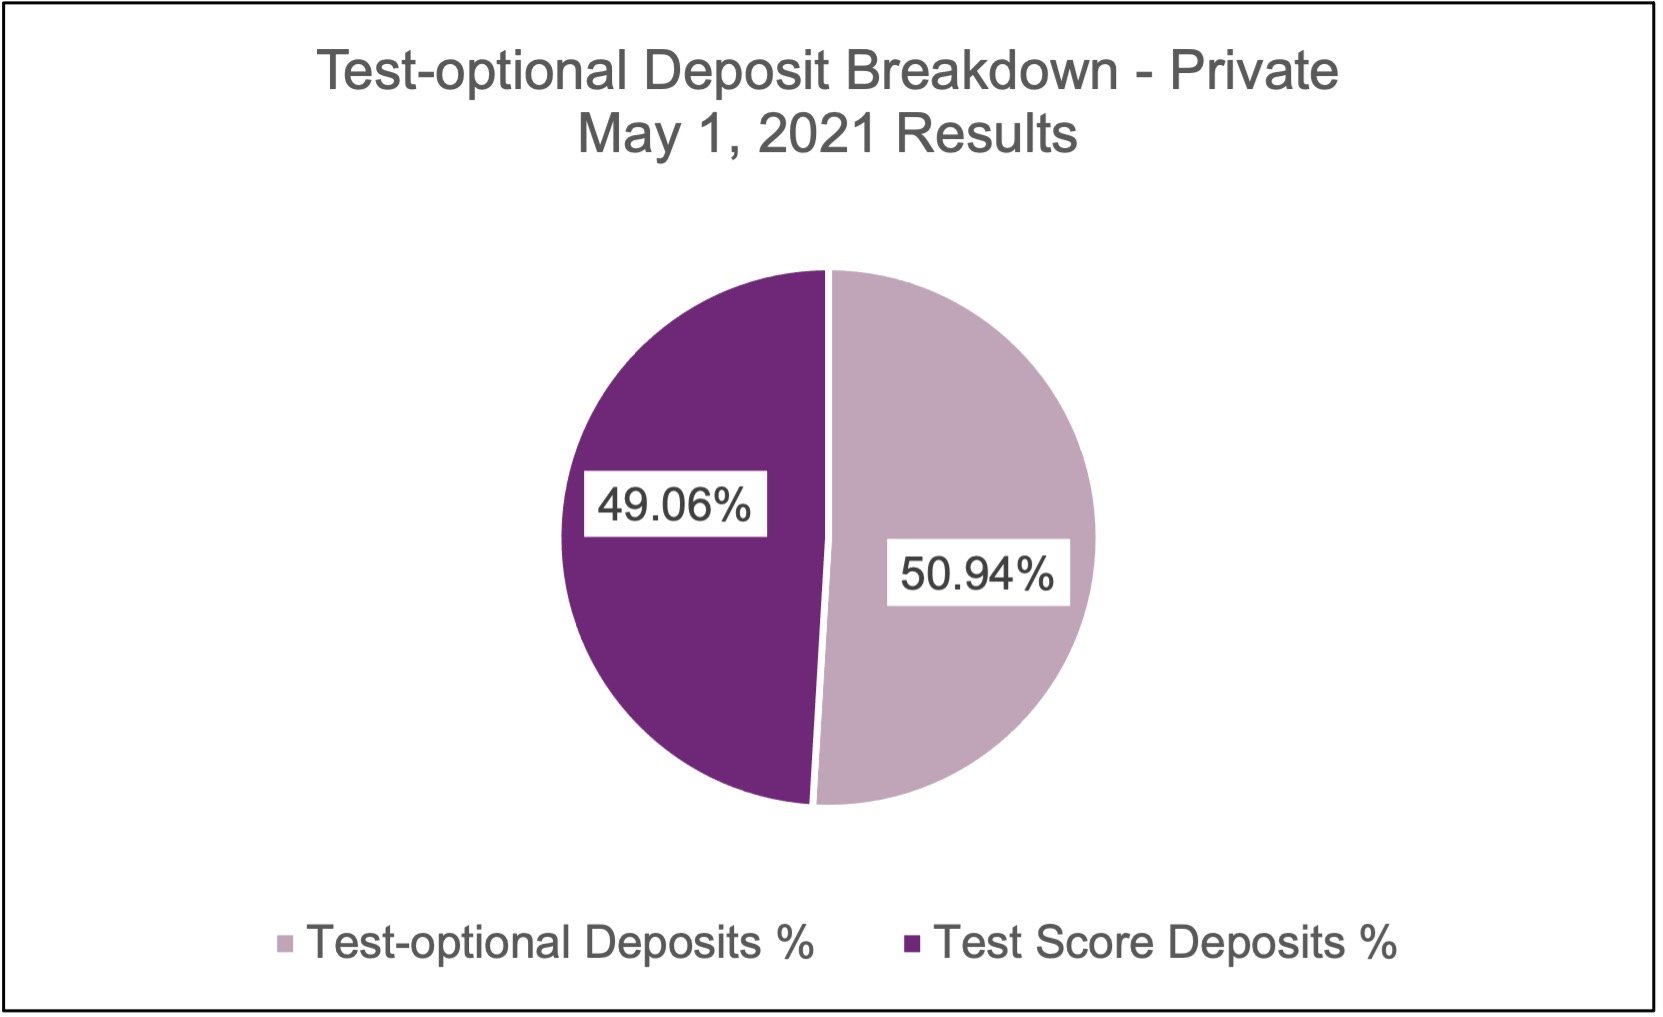
This chart shows test-optional deposits at private institutions. |
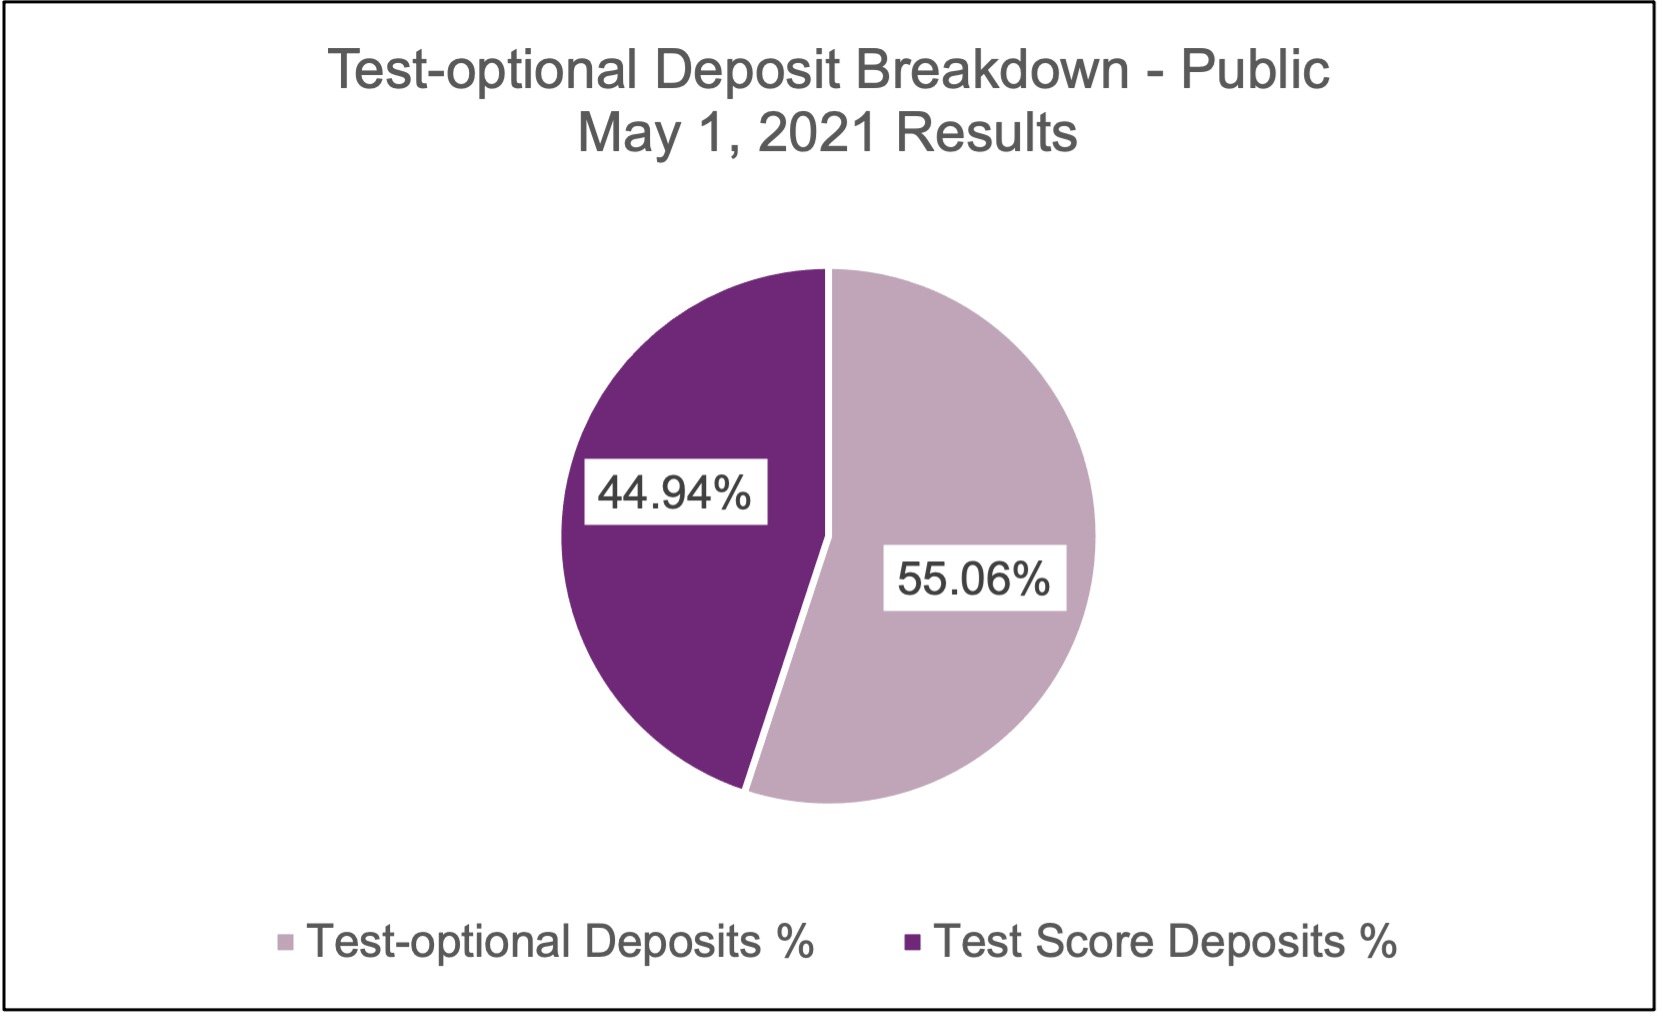
This chart shows test-optional deposits at public institutions. |
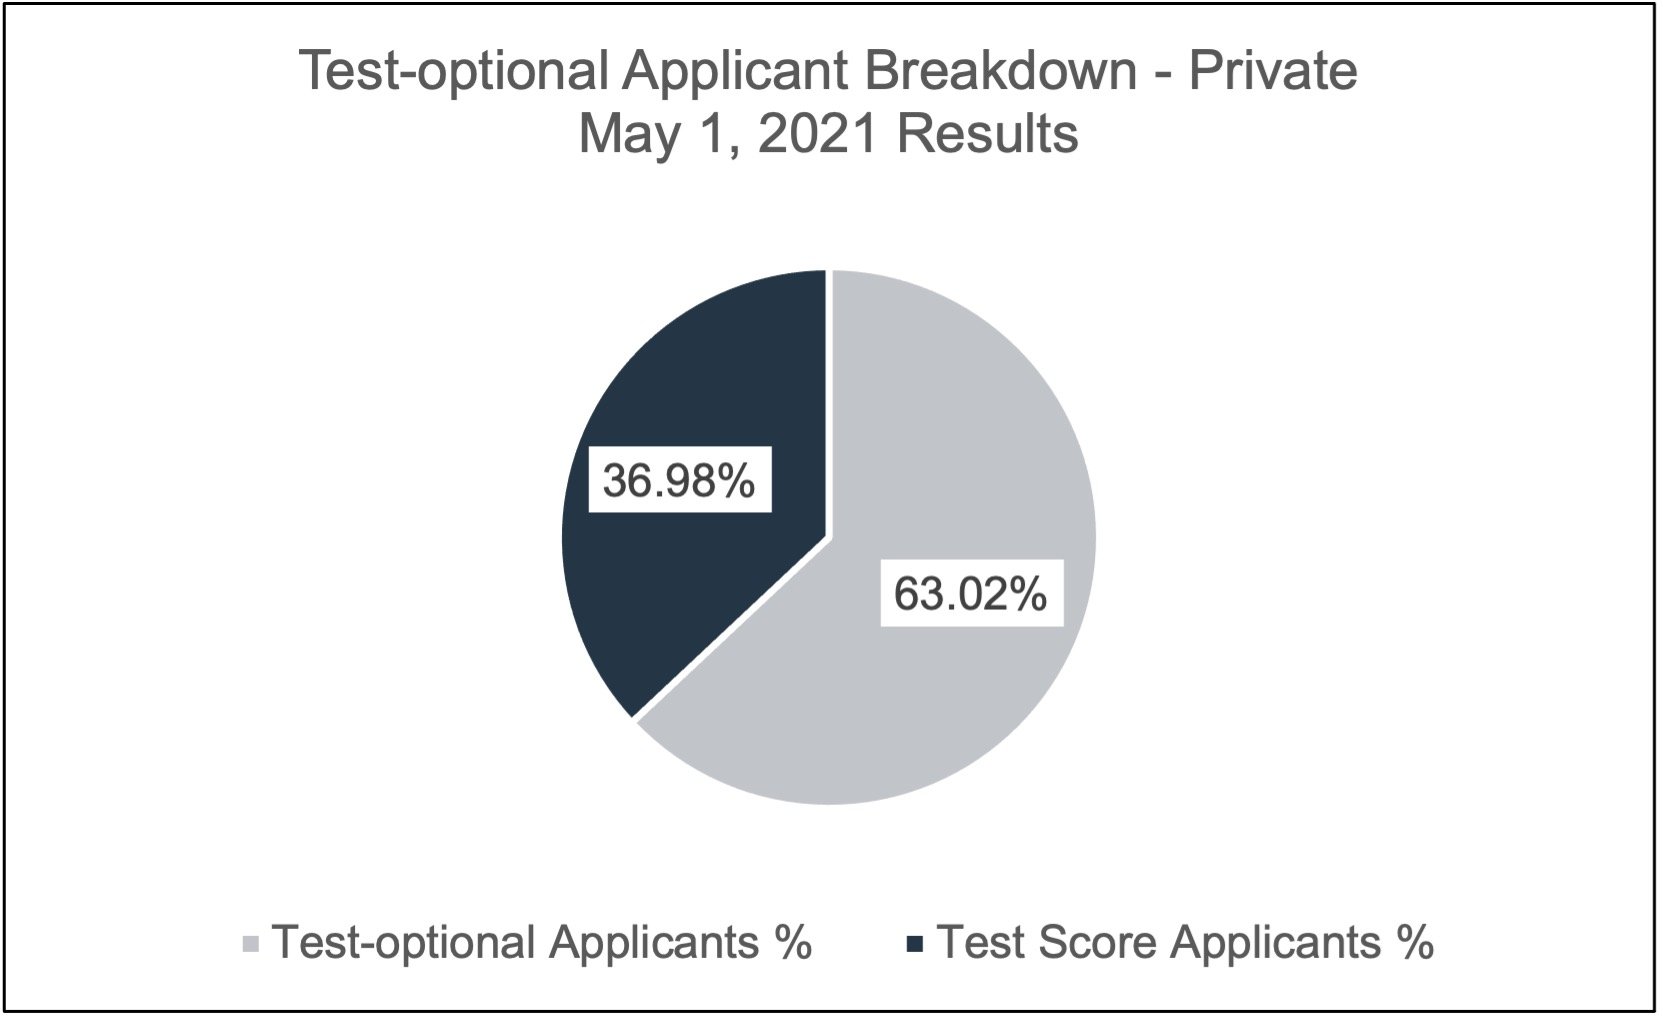 This chart shows test-optional applicants at private institutions.
In reviewing the test-optional results, it’s interesting to see how the proportion of test-optional applicants decreased to test-optional admits and even more so to the test-optional deposits. While public institutions tended to keep a closer distribution across the three phases, private institutions had almost a 50/50 split in test-optional deposited students compared to a 35/65 split at the applicant stage.
We plan to research this trend and discuss it with our partner institutions to discover the reasons behind it.
We’ve heard from our partner institutions that most didn’t think there would be a high percentage of students applying without test scores. Some institutions expected around 20-30%, but the proportions are higher, as you can see from the results.
This is already driving some institutions to re-evaluate their admission criteria and merit-based scholarship structure for the Fall 2022 cycle.
Yield and merit-based scholarships may not align with budget plans.
Keep in mind that this is a summary of our partner institutions. Some of them, both private and public institutions, were already test-optional for admissions.
What Do These Trends Mean for the 2021 Enrollment Cycle?
Results for applicants, admits, and deposits are ahead of last year’s trends for both private and public institutions. But we should remember that the pandemic started impacting results for the 2020 class around mid-March 2020.
The 2021 results may seem promising. However, the test-optional approach, a year of virtual interactions, and still some uncertainly for how institutions will operate this Fall are reasons to monitor trends throughout the summer.
As you review the results for your own institution, start to shift your tactics to monitor other key data elements from your melt mitigation. Data points that are behavioral in nature, such as attending orientation, registering for classes, completing housing contracts, paying bills or setting up installment plans, and other activities can truly help you understand if the deposited students as of May 1 will actually be enrolled at Fall census.
We will continue to monitor trends and provide additional updates for June 1 and into the Fall so that you can benchmark against other institutions. This analysis will focus on trends in deposits and later stage activity, such as melt mitigation.
We strongly suggest you monitor your own activities in the coming months too!
Stay tuned for more trends and insights.

Othot Partner Success Team