
Othot Team
We’ve made it through yield season!
How’d it go for your institution?
Our partners fared well throughout yield season as deposits continued to outpace 2020.
For our June 1 enrollment trend analysis, we’re shifting focus away from the applicant, admit, and FAFSA submission data, and spending more time monitoring deposits and summer melt. Our observations and insights are based on new first-time student institutional data captured as of June 1, 2021.
You can go back any time to read our enrollment trends posts from March 1, April 1, and May 1 for information about applicant, admit, FAFSA submission, and deposit trends.
Key Takeaways
A few of the key takeaways from the June 1 data:
- The average deposit trends are still increasing when compared to 2020. However, they have declined slightly from the rate seen on May 1.
- Private institutions continue to outperform public institutions in deposit trends when comparing the 2021 and 2020 enrollment cycles.
- The melt rate for public institutions is relatively flat. Melt for private institutions is extremely high. However, the results are based on a very small population at this time in the cycle.
Keep reading for the 2021 enrollment trends for private and public institutions, focusing on deposit and melt results.
Deposit Trends
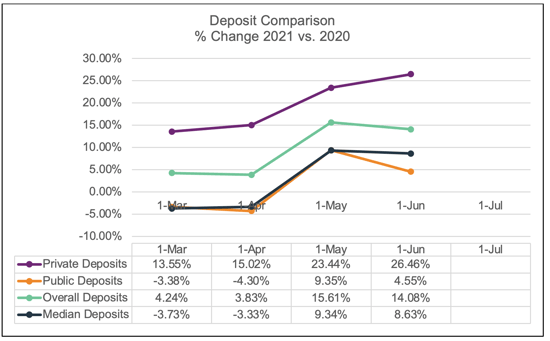
2021 deposit rates as compared to 2020 remain higher on June 1. Overall, the deposit rate is 14.08% ahead of last year, even though it was previously at 15.61% on May 1.
Private institutions are still outperforming public institutions compared to 2020. As you can see in the chart, as of June 1, privates are at 26.46% vs. publics at 4.55%. Deposit rates have declined since May 1, where they were previously 23.44% and 9.35%, respectively.
The June 1 results are a promising sign for enrollment growth and a better comparison point than May 1.
Thinking back to last year’s enrollment cycle, many institutions pushed back the decision deadline from May to June.
A higher deposit rate on May 1, 2021 made sense since the typical volume of decisions came in this year, while decisions last year were delayed until June 1.
Comparing the June results shows what could be considered like for like decision points between the years, and seeing higher deposit rates is significantly better now.
Melt Trends
As we get into the summer months, it is a critical time to monitor melt rates. In a year of test-optional admissions, virtual interaction, and many other changes, deposit rates are higher, but knowing whether they are realistic or artificial is yet to be determined.
That is until we see the trends for melt.
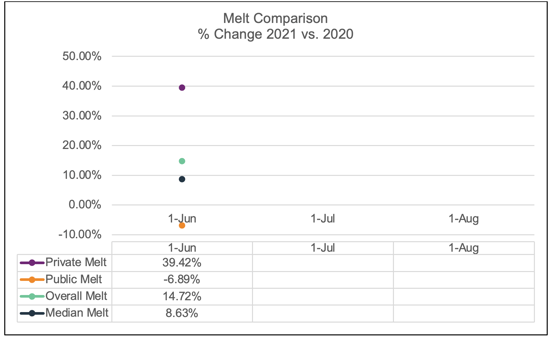
It is too early to determine any substantive trend or insight for melt based on the current data. Melt this time of year is generally low across our partner institutions. Seeing a few students swing up or down could significantly impact the results. While melt rates at public institutions are similar to last year, with a slightly lower rate of -6.89% (negative is good), private institutions are seeing a much higher melt than last year at 39.42%.
But with only single- or double-digit melt quantities for private institutions, any data scientist or data analyst knows the population is still too small for tangible and actionable results just yet.
What Do These Trends Mean for the 2021 Enrollment Cycle?
Results for deposits remain positive as of June 1, even with the slight decline from May 1. They are a more realistic comparison point between 2021 and 2020. Some of our partner institutions may still have additional deposits, but we don’t expect significant changes in deposit rates moving forward.
It’s too early to tell with melt.
As we approach July 1, August 1, and especially September 1, monitoring melt rates will provide a clearer picture for the Fall 2021 class.
It is critical to monitor behavioral attributes such as attending orientation, registering for classes, completing housing contracts, paying bills or setting up installment plans, and other activities to understand if the deposited students will actually be enrolled at Fall census.
We will continue to monitor trends and provide updates throughout the summer leading to the Fall census so you can benchmark against other institutions. As we shift to review deposit and melt trends, we strongly suggest you monitor your own trends and activities in the coming months too!
Stay tuned for more trends and insights.

Othot Team