
Othot Partner Success Team
What does our July 1 enrollment data reveal about deposits and summer melt?
If you’re a returning reader to our Enrollment Pulse series, welcome back!
If you're joining us for the first time, you can read our monthly snapshots about applicant, admit, FAFSA submission, and deposit trends from March 1, April 1, May 1, and June 1.
The July 1 enrollment trend analysis focuses on deposits and summer melt and how the trends are changing and taking form as we get closer to the Fall census. Our observations and insights are based on new first-time student institutional data captured on July 1, 2021.
Key Takeaways from the July 1 Data:
- Deposits at private institutions are still ahead of 2020 by more than 20%. However, the proportional increase over last year is not as large.
- The proportional increase in deposits at public institutions increased compared to June 1, but the increase is not as significant as it was on May 1. Most schools extended the deposit deadline beyond May 1 last year, accounting for the month-to-month differences in the proportional increase in deposits. This year a significant number of schools either officially extended the deadline or simply kept accepting deposits.
- Compared to last year, July 1 melt is lower among both private and public institutions. The decrease in melt among private institutions is significant, indicating that institutions are engaging students.
- Colleges and universities must continue to engage students throughout the summer so they do not lose them to another institution.
Keep reading to find out enrollment trends for private and public institutions, focusing on deposit and melt results.
Deposits
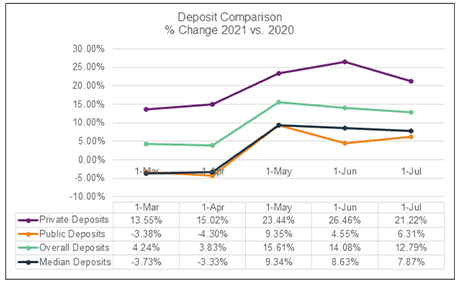
2021 deposit rates remain higher on July 1 compared to 2020. Overall, the deposit rate is 12.79% ahead of last year, even though it was previously 14.08% on June 1 and 15.61% on May 1. Last year, more students deposited after the traditional May 1 deadline than in previous enrollment years (2019 and prior).
Private institutions are still outperforming public institutions compared to 2020.
As you can see in the chart, as of July 1, privates are at 21.22% versus publics at 6.31%. Deposit rates from June to July are opposite of what we observed between May to June. Deposits decreased for privates while they increased for publics as of July 1.
Melt Trends
 As we progress through the summer months, we are continuing to monitor melt rates. Othot partner institutions (both public and private) experienced incredible growth in deposits this year. We wanted to determine if the increase in deposits translates to an increase in enrollees and not an artificial peak.
Based on the current data, the total number of students canceling is still relatively low. The melt rates we track account for the percentage of canceled deposits compared to the total gross deposits.
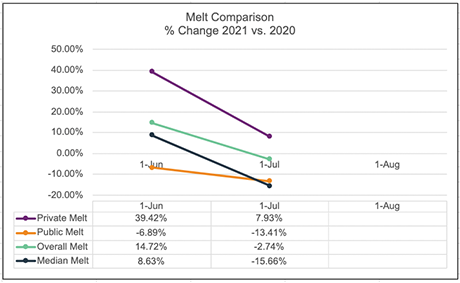
Compared to the 2020 melt rates, this year private institutions have slightly more melt, while public institutions have much less melt. Note that negative melt number is a positive indicator, indicating there are fewer canceled deposits (numerator) than gross deposits (denominator) in 2021 versus 2020.
The melt rate for public institutions is 7.93% as of July 1, while the melt rate for public institutions is at -13.41%
What Do The Trends Mean for the 2021 Enrollment Cycle?
When we look at the average deposit and melt data from our private and public partner institutions as of July 1, it appears all institutions will enroll more students than they enrolled in Fall 2020. However, for students and parents, significant uncertainty about the fall semester at institutions remains. Will classes be in-person or virtual? Will campuses curtail residential living and campus life? Will vaccines be required?
With the sharp increase in cases of the Delta variant of COVID-19 nationwide, uncertainty worsens. It begs the question—are students depositing at multiple institutions? For institutions, the uncertainty increases the risk that student melt will spike as we move toward the census date.
Here are recommendations to help your institution over the next few months:
- Institutions cannot afford to be complacent over the next several weeks. Institutions must sustain or develop and implement ASAP comprehensive and aggressive communication and engagement plans to keep prospective and current students and families informed and feel like they are part of the university community to mitigate melt and support retention. We’ve already seen this activity in action, with institutions offering much more on-campus programming for deposited students beyond orientation.
- If your institution is using predictive and prescriptive analytics, you can identify the students at the highest risk of melting and which tactic(s) will increase that student’s likelihood to enroll. We are currently supporting our partner institutions to manage this type of activity.
- It is unlikely that most international students who have submitted deposits will be able to enroll in the fall semester. Institutions should plan and coordinate across their entire campus, from academics to student life, to matriculate those students in the spring semester.
- As we wrote in the June Snapshot, it is critical to monitor behavioral attributes such as attending orientation, registering for classes, completing housing contracts, paying bills or setting up installment plans, and other activities to understand if the deposited students will actually be enrolled at Fall census. At this point, institutions must be cross-referencing those lists. For instance, who attended orientation but hasn’t submitted a housing contract?
We will continue to monitor trends throughout the rest of the enrollment cycle leading up to the Fall census. The monthly snapshot data will culminate with the 2021Higher Ed Enrollment Trends Pulse Report, providing the complete 2021 data and observations, as well as comparisons to national trends.
What happened last year? Download the 2020 Higher Ed Enrollment Trends Pulse Report.
Stay tuned for our final trends analysis and insights later this Fall!

Othot Partner Success Team